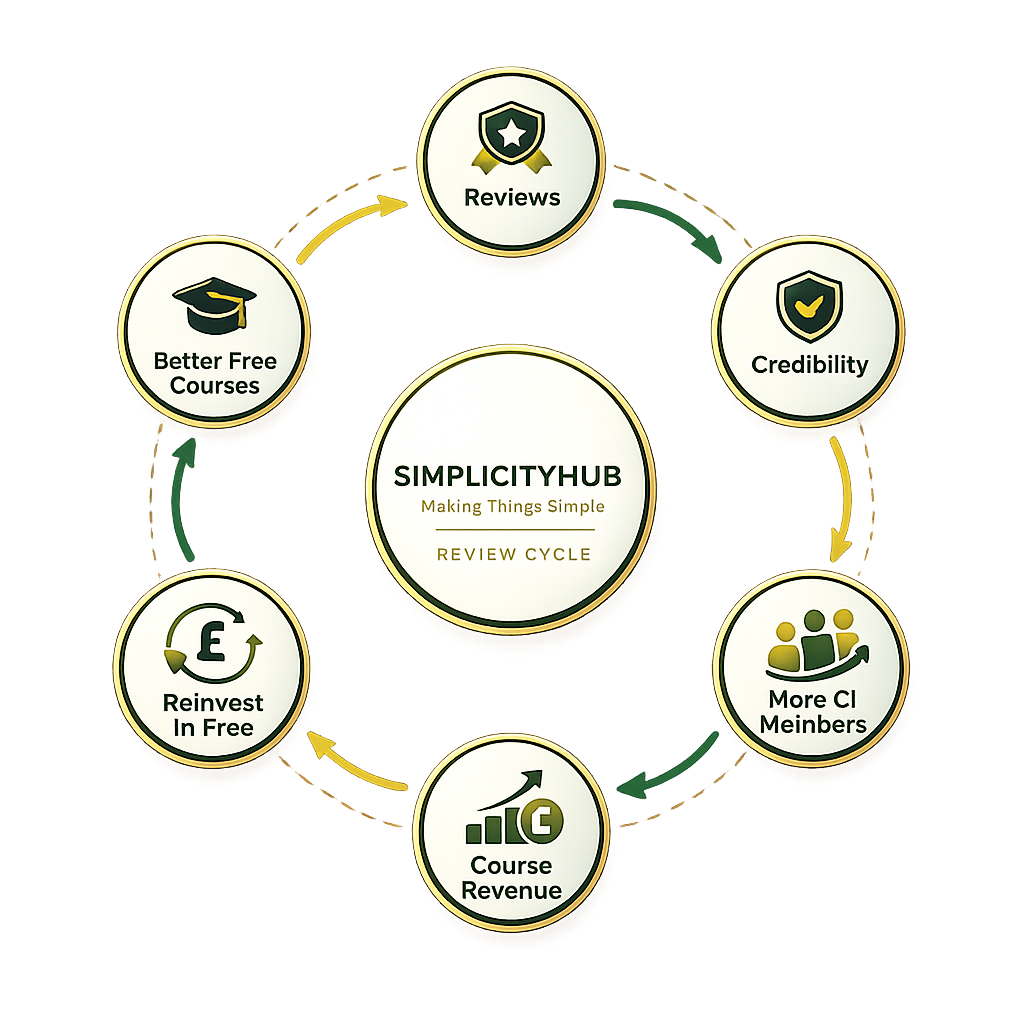
Why your review matters
Free courses take time and money to create. Your review gives us credibility, brings in more learners, and we plough that revenue straight back into free resources.
Paste your defect or cost data, rank the categories from largest to smallest, and instantly visualise the Pareto principle — with descending bars, a cumulative percentage line, and the 80% threshold highlighted.
Enter your values on the left, then press Calculate.
Watch: understand the concept, then see the calculator in action
Six categories of customer complaint, last month. Enter the lab and let the 80/20 rule show you exactly where to focus first.
Use the calculator above to paste raw defect, cost or complaint data and instantly produce a ranked Pareto chart with descending bars, a cumulative percentage line and the 80% threshold highlighted. The chart turns a messy long list into a short, defensible improvement priority — the few categories that drive most of the impact.
A Pareto chart ranks categories from largest to smallest and overlays a cumulative percentage line. It is named after the Pareto principle (80/20 rule) which observes that roughly 80% of effects come from 20% of causes. In Lean Six Sigma it is the standard tool for prioritising defects, cost drivers, complaint reasons and downtime causes.
The calculator sorts your categories by frequency (or cost) high-to-low, then computes the cumulative percentage as a running sum divided by the grand total. The cumulative line crosses 80% somewhere in the early categories — those are the vital few that should be tackled first; everything to the right is the trivial many.
A QA team logs 480 defects across 12 categories in a month. Sorting by frequency, the top three categories — surface scratch (180), wrong label (110) and seal failure (75) — total 365, or 76% of all defects. The next category alone takes the cumulative to 82%.
The team focuses kaizen effort on those three causes rather than spreading thin across all twelve. After two months the top-three rate halves, and a fresh Pareto reveals a new top three — at which point the cycle repeats. That is the engine of continuous improvement.
Pareto stops improvement teams chasing every small issue. It produces a defensible, data-driven shortlist of two-to-three causes that, if fixed, will eliminate the majority of the problem volume or cost.
Use Pareto on defect categories, complaint reasons, downtime causes, scrap cost by SKU, or any data set with multiple categories competing for attention. It is the first tool to reach for in the Analyse phase of DMAIC.
Pareto sits alongside cause-and-effect diagrams, the 5 Whys and control charts as a core Six Sigma analysis tool. It identifies which causes to investigate; the other tools explain why those causes happen.
Take the top two-to-three categories and launch a focused improvement event — a fishbone diagram, 5 Whys or kaizen — on each. Re-run the Pareto monthly so the next set of priorities surfaces as today’s top causes are removed.
Combine Pareto with cause-and-effect tools to convert "what is biggest" into "why does it happen". The resources below cover both halves of the workflow.
A bar chart with categories ranked from largest to smallest and a cumulative percentage line overlaid. It highlights the vital few categories that drive most of the volume or cost.
The Pareto principle observes that approximately 80% of effects come from 20% of causes. In practice the ratio varies (70/30, 90/10), but the principle that a small number of causes dominate is remarkably consistent.
Any time you have multiple categories of defects, costs, complaints or downtime causes and need to choose where to focus improvement. It is the standard prioritisation tool in DMAIC Analyse.
It depends on the question. By count when frequency matters (e.g. customer complaints); by cost when financial impact matters (e.g. scrap value). They often produce different top categories — both can be useful.
After every meaningful improvement initiative. The point of Pareto is to find today’s top causes; as you fix them, new causes rise to the top and become the next priority.
Want to know how to use Pareto analysis to prioritise improvement work? The Yellow Belt covers this in full.
View Yellow Belt →Free courses take time and money to create. Your review gives us credibility, brings in more learners, and we plough that revenue straight back into free resources.