What problem are you trying to solve?
Tell us what’s going on — e.g. "I want to know if my process is stable" — and we’ll point you straight to the exact free templates and calculators that help, plus the course that covers them in depth.
Practical template guides
Choose the right tool before downloading it. These answer-first guides explain when a tool fits, when it does not and what to do next.
Free templates.
Built to be used.
100+ free Lean Six Sigma and Lean templates, each with a completed example. Every template includes a filled-in worked example alongside the blank version, showing how the tool is used on a real improvement project. Download in Excel, Google Sheets, Apple Numbers or PDF. No software licence required. No registration is needed. The library covers every DMAIC stage and Lean operations tools including 5S, value stream mapping, kaizen, daily management and waste assessment.
Browse & download templatesWhy completed examples matter
Most template libraries give you a blank document. SimplicityHub templates include a completed example alongside the blank version so you can see how the tool should be used before applying it to your own project. This is the difference between a template that sits in a folder and one that actually gets used.
Built for real work in operations, quality, and business improvement.
Most common templates, bundled by belt
Grab the templates our Yellow, Green and Black Belt learners use most — one ZIP per belt, each including a free copy of our DMAIC Templates Guide.
Most Common Yellow Belt Templates
The 17 templates Yellow Belt learners reach for most, covering all 5 DMAIC phases from Define through to Control.

Most Common Green Belt Templates
22 templates covering everything a Green Belt project needs, including statistical tools like Correlation Analysis and Hypothesis Testing.
Most Common Black Belt Templates
The full 25-template set for Black Belt projects, adding Value Stream Map, Cost Benefit Analysis, Solution Prioritisation Matrix and Project Closure Report.
Project Charter
Set the project up properly with scope, objectives, stakeholders, measures, risks and ownership in one practical working template.
SIPOC Template
Map suppliers, inputs, process, outputs and customers at a high level so the team can align on what the process actually covers.
Problem Statement
Write the problem clearly and factually so the team understands what is happening, where it is happening and why it matters.
Goal Statement
Translate the project objective into a measurable target with timing, baseline and intended outcome so success is easier to judge.
Business Case
Set out the reason for doing the work, expected benefits, strategic fit and value case in a format that supports better decision-making.
Stakeholder Analysis
Identify who matters, what they care about, how influential they are and what level of engagement is needed to move the work forward.
RACI Matrix
Clarify who is responsible, accountable, consulted and informed so project activity is cleaner and role confusion is reduced.
Communication Plan
Plan what gets communicated, to whom, when and by whom so the project keeps people informed without creating noise.
Project Risk Assessment
Capture delivery risks, likely issues, mitigation actions and owners so the team can manage threats before they slow the project down.
Voice of the Customer (VOC)
Capture customer needs, expectations and feedback in a structured way so the team can align improvement work to what really matters to users and stakeholders.
CTQ Tree
Define critical-to-quality requirements by translating customer needs into measurable process characteristics.
Kano Analysis
Classify customer requirements so the team can distinguish must-be, performance and delighter needs.
Meeting Agenda
Keep improvement meetings focused with a practical agenda for decisions, actions, owners and follow-up.
SIPOC-R
Frame the process from suppliers and inputs through outputs and customers, with risks made visible from the start.
Team Charter
Align the improvement team on purpose, scope, roles, decision rights, measures and ways of working.
Process Map
Visualise the current process flow step by step so the team can understand how work actually moves through the process today.
Data Collection Plan
Define what data will be collected, where it comes from, who collects it and how often it should be captured.
Operational Definitions
Create clear shared definitions so everyone records, interprets and measures the data in the same way.
Sampling Plan
Set the sample size, selection method and collection frequency so your data is reliable without overcomplicating the work.
Measurement System Check
Check that your measurement method is stable, repeatable and trustworthy before using the results for analysis.
Baseline Metrics
Capture the current level of performance before changes are made so the project has a clear starting point.
Run Chart
Track performance over time to spot trends, shifts and emerging patterns in process results.
Control Chart
Monitor process stability and distinguish common cause variation from signals that something unusual is happening.
Process Capability
Assess whether the process can consistently perform within the required limits or customer expectations.
Value Stream Map
Map the end-to-end flow including process time, waiting and waste so the team can see the system more clearly.
Measurement Definitions
Define how each measure is calculated, captured and reported so data is collected consistently across the team.
Simple Tally Sheet
Count occurrences of issues, defects or events quickly with a clean, printable tally layout.
5 Whys
Identify root causes by repeatedly asking why the problem occurs until the underlying issue becomes clearer.
Fishbone Diagram
Structure possible causes into logical categories so teams can analyse problems more thoroughly and avoid shallow assumptions.
Pareto Chart
Prioritise the biggest contributors to the problem so effort is focused on the causes with the greatest impact.
Failure Mode Identification
Identify where the process can fail and what the likely effects are so risks and weaknesses are exposed early.
Correlation Analysis
Assess whether variables appear to move together so suspected relationships can be explored using evidence.
Hypothesis Testing Planner
Plan the right statistical test, data requirements and decision logic before running formal analysis.
Cause Validation Matrix
Test suspected causes against available evidence so the team can separate assumptions from validated drivers.
RCA Worksheet
Document structured root cause analysis findings, evidence and validated conclusions in one place.
Quick Pareto Log
Capture and rank the most frequent issues fast so the team can focus on the biggest contributors first.
Simple 5 Whys Worksheet
Work through a problem one "why" at a time to move past symptoms and land on a real root cause.
Fishbone Starter
A lightweight fishbone layout to brainstorm possible causes across people, process, equipment, materials and environment.
Cause Shortlist
Narrow a long list of possible causes down to the few most likely drivers so analysis effort is focused.
Data Summary Sheet
Pull together key figures, averages and ranges in one place so patterns and outliers are easier to spot.
Issue Log
Track ongoing issues, their status, owners and impact so nothing gets lost during analysis and problem-solving.
Affinity Diagram
Organise large volumes of ideas, observations or causes into meaningful themes the team can act on.
Box Plot
Compare distributions, spread and outliers across groups so the team can see where variation is concentrated.
Multi-Vari Chart
Visualise variation across time, position and cyclical sources to expose patterns that summary statistics can hide.
Solution Prioritisation Matrix
Compare solution options systematically so the team can focus on the actions with the strongest overall case.
Impact vs Effort Matrix
Sort possible improvements by likely value and delivery effort so quick wins and bigger bets are easier to see.
Cost Benefit Analysis
Weigh likely costs against expected gains so proposed solutions can be justified more clearly.
Pilot Plan
Plan how the change will be tested on a smaller scale before broader rollout begins.
Solution Testing Plan
Set out what will be tested, how success will be judged and what evidence will be reviewed.
Change Implementation Plan
Plan the rollout activity, owners, timing and dependencies needed to move the change into practice.
Risk Mitigation Plan
Capture implementation risks, prevention actions and contingency steps before changes are introduced.
Action Plan
Break the agreed improvements into practical actions, owners and due dates so delivery is easier to manage.
Change Checklist
Run through the key steps needed to plan, test and deploy a change safely without missing anything.
Simple Solution List
Capture candidate solutions with their expected impact and effort so the team can compare and choose.
Quick Win Tracker
Log fast, low-risk improvements and track them through to completion so momentum stays visible.
Stakeholder Feedback Log
Record feedback from users, customers and stakeholders during pilots or change roll-outs in one clear log.
Before and After Comparison
Compare key metrics and process behaviour before and after a change to show the real impact clearly.
A3 Problem Solving
Guide a disciplined A3 story from problem definition and root cause through countermeasures, follow-up and learning.
Change Management Plan
Plan the people, communication, training and adoption actions needed to make an improvement stick.
Force Field Analysis
Assess the forces supporting and resisting a change so the team can strengthen enablers and reduce barriers.
Idea Generation Log
Capture improvement ideas consistently, including source, owner, expected benefit, effort and next action.
Mistake-Proofing Log
Record error-proofing opportunities, proposed controls, ownership and verification so defects are prevented at source.
Pugh Matrix
Compare alternative concepts against a datum using consistent criteria before selecting a preferred solution.
Solution Selection Matrix
Score solution options against weighted criteria to support a balanced, defensible improvement decision.
To-Be Process Map
Design the future-state process with clearer flow, ownership, controls and reduced waste before implementation.
Weighted Criteria Matrix
Weight decision criteria and score options consistently so trade-offs are visible when selecting an improvement.
Control Plan
Set out how the improved process will be monitored, owned and kept under control after implementation.
Standard Operating Procedure
Document the agreed standard way of working so the process is carried out consistently after the change.
Monitoring Dashboard
Track key control measures in one place so performance can be reviewed quickly and regularly.
Audit Checklist
Use a structured checklist to check whether the new process is being followed as intended.
Sustainability Plan
Plan the activity needed to keep the gains in place over time, including ownership, review and reinforcement.
Handover Checklist
Make sure everything needed for handover is complete before the project responsibility transfers to the process owner.
Lessons Learned Log
Capture what worked, what did not and what should be repeated or avoided in future projects.
Project Closure Report
Summarise the project outcome, control arrangements and final conclusions at the point of closure.
Results Tracker
Track the sustained performance of a change over time so improvement gains do not quietly slip backwards.
Daily Check Sheet
Run short, consistent daily checks on the things that matter most so problems surface early.
Escalation Guide
Make clear what gets escalated, to whom and when so issues are handled at the right level quickly.
Project Summary One-Pager
Summarise the project, outcome, key learnings and sustained impact on a single, shareable page.
Benefits Tracker
Track expected and realised benefits, owners, measures and review dates after an improvement goes live.
Escalation Matrix
Clarify who should be contacted, when and how, when process performance or risk moves outside control.
KPI Dashboard
Summarise the measures that show whether process performance, quality and benefits remain on track.
Process Review
Use a repeatable review structure to check performance, issues, actions, risks and opportunities for further improvement.
Project Status Report
Communicate project progress, milestones, risks, decisions, actions and support needed in a concise status view.
Response Plan
Define the trigger, immediate response, owner and follow-up when process performance moves outside the expected range.
Advanced Toolkit Packs — available now
Structured, ready-to-use template packs designed for real improvement work. Pick the pack that matches your project and get started straight away.
Process Improvement Starter Pack
A starter pack for identifying improvement opportunities, measuring baselines and planning action.
Root Cause Analysis Toolkit
A practical RCA toolkit for defining problems, finding causes, validating evidence and creating action.
A3 Template Pack
A clean A3 problem-solving pack for concise, visual improvement thinking and follow-through.
Bottleneck Analysis
Identify the constraint that limits process performance and understand where flow slows down so improvement effort can be focused in the right place.
Capacity Planning Sheet
Calculate available capacity against demand so teams can plan resources realistically and avoid overload or under-utilisation.
Lead Time Calculator
Measure the total time taken for work to move from start to completion so delays and waiting time can be clearly understood.
Takt Time Calculator
Calculate the pace required to meet customer demand so production and service delivery can be balanced against real demand levels.
Throughput Tracker
Track output over time to monitor performance stability and understand whether changes are improving flow.
Workload Balancing Sheet
Distribute work evenly across people or steps so the process runs more smoothly and waiting time is reduced.
Process Flow Checklist
Check that a process flows cleanly from step to step with no avoidable stops, queues or rework.
Wait Time Tracker
Capture where and how long work waits between steps so hidden delay becomes visible.
Simple Cycle Time Log
Record cycle times for a process step over several runs so variation and typical performance are clear.
Spaghetti Diagram
Trace movement through a workplace or process to expose unnecessary travel, handling, waiting and layout waste.
5S Audit Sheet
Audit workplace organisation against 5S principles so teams can sustain cleaner, safer and more efficient working environments.
8 Wastes Assessment
Review a process against the eight wastes of Lean so teams can spot inefficiency, delay and unnecessary effort more consistently.
Continuous Improvement Log
Capture improvement ideas, actions, ownership and progress in one place so operational improvement work is easier to track and review.
Daily Management Board
Structure daily operational review conversations around performance, issues, actions and accountability so teams stay aligned and responsive.
Gemba Walk Checklist
Guide structured observation at the place where work happens so leaders and teams can see issues, barriers and opportunities first-hand.
Kaizen Event Planner
Plan focused improvement events with clear objectives, timings, responsibilities and follow-up so Kaizen activity leads to measurable change.
Process Observation Sheet
Record what is seen during process observation so teams can document variation, delays, rework and issues in a structured way.
Standard Work Template
Define the agreed best current method for completing a task so work is carried out more consistently, safely and efficiently.
Visual Management Board
Make performance, priorities, actions and issues visible at a glance so operational control becomes easier and communication improves.
Waste Identification Checklist
Use a practical checklist to spot non-value-added activity across a process so teams can identify improvement opportunities more quickly.
Training Needs Analysis
Identify the capability, knowledge and support needed for people to perform the process safely and consistently.
More templates on the way
The SimplicityHub template library is growing. Got a specific template or resource you need? Let us know and we will add it to the roadmap.
Use the right template at the right stage
SimplicityHub templates are designed to support practical Lean Six Sigma, continuous improvement, quality, and operational excellence work. Each template includes a completed example so you can see how it should be used before applying it to your own project.
Start with the problem
Use project charters, SIPOC, VOC, CTQ and problem definition templates to clarify the issue, scope the work and agree what success looks like.
Analyse the process
Use process maps, waste walks, data collection plans, Pareto analysis, root cause tools and capability templates to understand where performance is being lost.
Control the improvement
Use action plans, control plans, audit checklists, standard work and handover templates to lock in the improvement and make the change sustainable.
Templates that support your Lean Six Sigma training
These free templates can be used alongside SimplicityHub Academy courses. Yellow Belt learners can use them to understand improvement basics, Green Belt learners can apply them through DMAIC projects, and Black Belt learners can use them to structure more advanced analysis and delivery.
Tool guides: what, when and how
Short, practical guides answering the most common questions about Lean Six Sigma tools — when to use them, what they do, and which one to start with.
Templates used across industries
These templates are used in manufacturing, healthcare, financial services, logistics, public sector and office-based improvement work. The tools are the same across every sector — the examples show how they adapt to different environments and constraints.
Frequently asked questions
Are the templates free to download?
Yes. The templates are free to download and use. They are designed to make improvement work easier without needing specialist software or a paid tool just to get started.
Do the templates include examples?
Yes. Each template includes a completed example so you can understand how the document should be used before applying it to your own process, team or project.
Which template should I start with?
For a new improvement project, start with a project charter, SIPOC, problem statement or VOC template. These help define the issue, align stakeholders and keep the work focused.
Can these templates support Lean Six Sigma projects?
Yes. The library includes templates commonly used across Define, Measure, Analyse, Improve and Control, including project charters, process maps, root cause tools, control plans and action trackers.
Are the templates suitable for work projects?
Yes. The templates are built for practical business improvement, quality, operations and continuous improvement work. They can be adapted for manufacturing, service, healthcare, logistics and office-based processes.
Do I need to be trained in Lean Six Sigma to use them?
No. The examples are designed to make the templates easy to follow. If you want more structure, the Yellow, Green and Black Belt courses explain how the tools fit into wider improvement projects.
Can I request a template?
Yes — absolutely. We actively build new templates based on real user needs. If you can't find what you're looking for, scroll to the bottom of the page and use the Request a template option in the More templates on the way section. You can also explore our calculators if a quick calculation would help solve the problem.
Lean Six Sigma by Industry
Industry Guide
Lean Six Sigma in Manufacturing
See how these tools apply on the shop floor — OEE, SMED, VSM and more. Practical examples from real manufacturing environments.
Explore manufacturingAI + Lean
Continuous Improvement with AI
Discover how AI is accelerating process improvement. From root cause analysis to automated reporting — the future of CI is already here.
Explore CI with AINot sure which template to use? Our blog breaks down when — and how — to use each one.
Want some insight?
Improvement tips straight to your inbox every week.
Pair your templates with our free calculators, or get the Ultimate DMAIC Playbook (£25, includes a free belt course).
Get your DMAIC template pack + the Ultimate DMAIC Playbook
Choose your level — 17, 22 or 25 templates across all 5 DMAIC stages, plus the 355-page PDF of the Ultimate DMAIC Playbook — on Amazon for £29.99, included free in every pack.
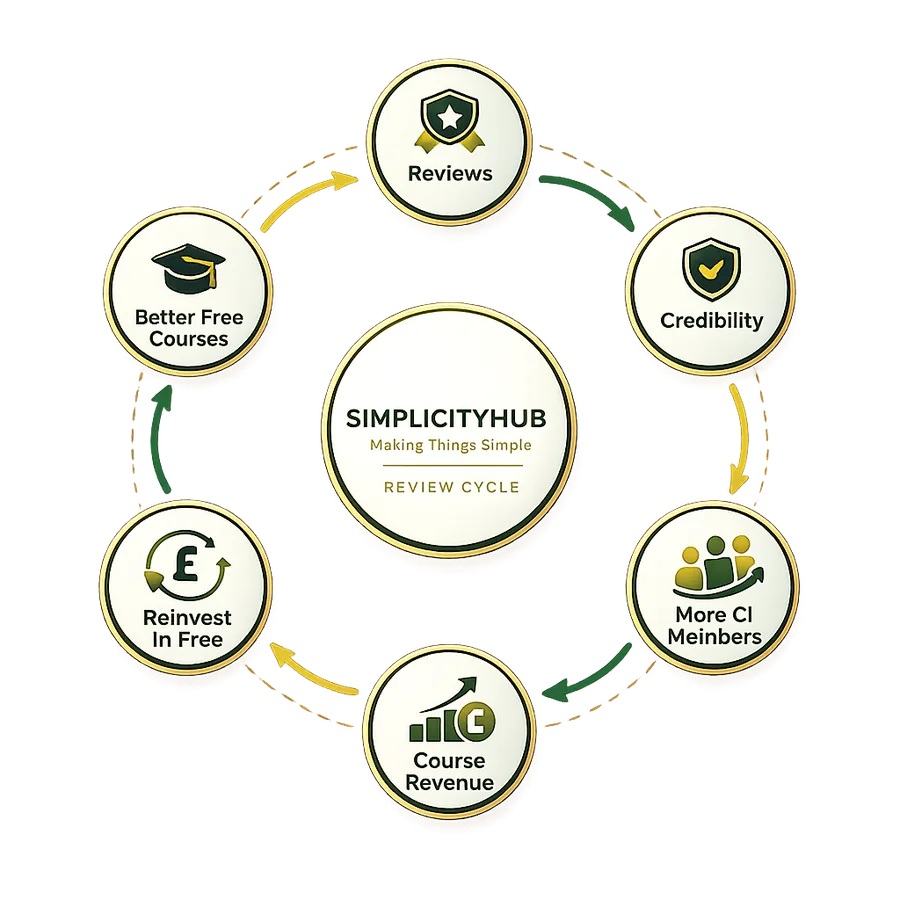
Why your review matters
Free courses take time and money to create. Your review gives us credibility, brings in more learners, and we plough that revenue straight back into free resources.

Two published books from SimplicityHub®
Practical, hands-on guides used by our learners — our Ultimate DMAIC and Ultimate Lean playbooks.