Most improvement projects do not fail because the methodology is wrong. They fail because the methodology gets lost somewhere between the training course and the actual work.
You know DMAIC. You have templates. You have a rough idea of which statistical tools belong in which phase. But when you sit down to run a real project, the structure dissolves. You are left with a folder of spreadsheets, a vague memory of what Anderson-Darling is for, and a project that drifts.
The SimplicityHub Assistants are built to solve that specific problem. Not by teaching you DMAIC again, but by putting a structured, AI-guided workspace in front of you so the method stays intact from Define through to Control.
This guide covers what each assistant does, how to use it, and how the two work together.
What the Assistants Are (and What They Are Not)
The SimplicityHub Assistants are browser-based software tools. You do not download anything. You do not need a Minitab licence or a statistics degree. You open the assistant, work through a structured workflow, and the statistical tools you need are already built in.
There are two core assistants.
| Assistant | Methodology | Best for | | --- | --- | --- | | DMAIC Assistant | Define, Measure, Analyse, Improve, Control | Formal project-based improvement work | | LEAN Assistant | Identify, Analyse, Improve, Sustain | Day-to-day operational improvement and waste reduction |
Both are available individually at £49, or together as the Complete package at £79, which includes every add-on tool. A 7-day free trial covers full access with no card required.
What they are not
These are not generic AI chatbots. Pasting your problem into ChatGPT and asking it to "help with DMAIC" produces loose, unstructured output with no workflow, no embedded tools, and no way to track progress through phases. The SimplicityHub Assistants are purpose-built: the AI is shaped by Lean Six Sigma Master Black Belt expertise and embedded inside a structured project workflow, not bolted on top of a general-purpose language model.
The DMAIC Assistant: A Walkthrough by Phase
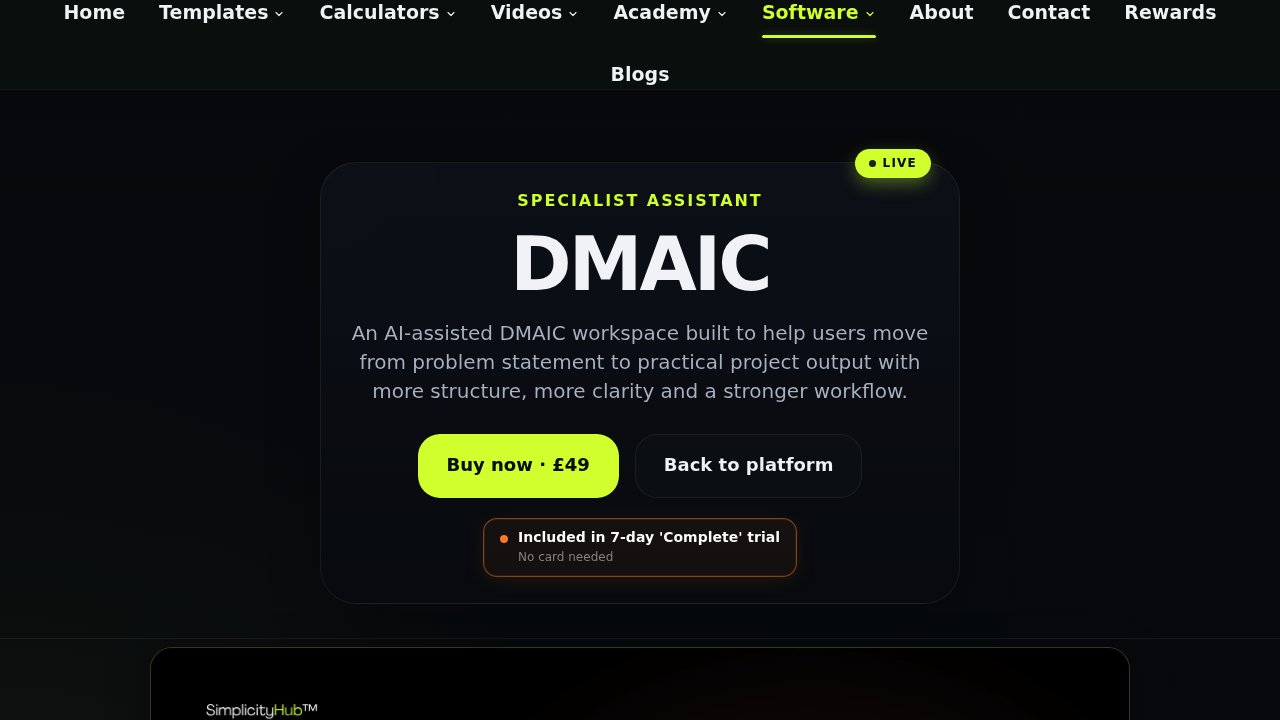
The DMAIC Assistant is the flagship tool. It walks you through all five phases of DMAIC with built-in statistical tools, templates, and AI support at each step.
!SimplicityHub DMAIC Assistant product page showing AI-guided project workflow from Define to Control
Define
Start by framing the problem properly. The assistant guides you through:
- Project Charter — scope, goals, team, timeline
- Voice of the Customer (VoC) — capturing what the customer actually needs
- Stakeholder Analysis — mapping who is affected and who needs to be managed
- Communication Plan — keeping the right people informed throughout
Most projects skip this rigour and pay for it later. A weak Define phase means the wrong problem gets solved. The assistant will not let you move forward without the inputs that matter.
Measure
The Measure phase is where most practitioners hit a wall. The statistical tools feel disconnected from the actual project. The DMAIC Assistant embeds them directly into the workflow.
Built-in tools at this phase include:
- Control Charts — to baseline current process performance
- Anderson-Darling Normality Test — to confirm whether your data is normally distributed before applying parametric tests
- Live Value Stream Map — to visualise flow and identify where data collection should focus
- Process Map — to document the current state accurately
Why this matters: knowing whether your data is normally distributed is not optional. It determines which statistical tests are valid in the Analyse phase. The assistant handles this check automatically.
Analyse
The Analyse phase is where statistical analysis does the heavy lifting. The assistant provides:
- Hypothesis Testing — t-tests, ANOVA, chi-square and more, with guidance on which test applies to your data type
- Pareto Chart — to rank defect categories and identify the vital few causes driving most of the impact
- Fishbone Diagram — structured cause-and-effect analysis to surface root causes
You do not need to remember which test to use. The assistant asks the right questions about your data and points you to the correct method. That is the difference between a tool that teaches statistics and one that helps you apply them.
Improve
Once root causes are confirmed, the Improve phase tools help you select and test solutions:
- Decision Matrix — to evaluate solution options against weighted criteria
- Full Factorial DOE (Design of Experiments) — to test multiple input variables simultaneously and identify the combination that produces the best output
- FMEA (Failure Mode and Effects Analysis) — to assess risk in the proposed solution before implementation
- Impact/Effort Matrix — to prioritise quick wins versus longer-term improvements
Control
The final phase ensures the improvement sticks. The assistant includes:
- KPI Dashboard — to monitor performance against targets post-implementation
- Process Map — updated to reflect the new standard
- Performance Analysis — to confirm the improvement is sustained over time
- Response Plan — documented actions if the process drifts back
The assistant also generates an A3 Storyboard and PowerPoint export at any point, so you can present project progress to stakeholders without rebuilding your slides from scratch.
The LEAN Assistant: Operational Improvement Without the Project Overhead
Not every improvement needs a formal DMAIC project. Some problems are visible, the cause is already understood, and what you need is a structured way to eliminate waste and improve flow quickly.
That is what the LEAN Assistant is for.
It follows the Identify, Analyse, Improve, Sustain (IAIS) framework, which is better suited to day-to-day operational improvement than the full DMAIC cycle.
When to use LEAN instead of DMAIC
| Situation | Use | | --- | --- | | You know there is waste but have not quantified it | LEAN Assistant | | You need to map value stream and reduce lead time | LEAN Assistant | | You have a complex, data-heavy problem with unknown root cause | DMAIC Assistant | | You are running a formal improvement project with stakeholder reporting | DMAIC Assistant | | You need both for a programme of work | Complete package |
What the LEAN Assistant covers
The four phases work like this:
- Identify — define the problem area, map the current state, and surface the 8 Wastes (DOWNTIME: Defects, Overproduction, Waiting, Non-Utilised Talent, Transport, Inventory, Motion, Extra Processing)
- Analyse — value stream and flow analysis, cycle time measurement, bottleneck identification
- Improve — structured waste elimination, flow redesign, and improvement prioritisation
- Sustain — standard work, visual management, and the daily habits that prevent backsliding
The 8 Wastes analysis is built in. You do not need to remember the DOWNTIME acronym or manually categorise observations. The assistant walks you through each waste type and captures what you find in a structured format that feeds directly into the Analyse phase.
How to Get Started
Getting into the assistants takes less than two minutes. There is no software to install and no account setup required for the free trial.
Step 1: Start the free trial
Go to the SimplicityHub software page and select the assistant you want to try. The 7-day Complete trial gives you full access to both DMAIC and LEAN Assistants, plus every add-on, with no card required. If you already know you want one assistant, you can go straight to the individual product page.
Step 2: Open your first project
When you enter the assistant, you will be prompted to name your project and write a brief problem statement. Do not overthink this. A rough description of what is wrong and where is enough to get started. The assistant will help you sharpen the framing as you work through the Define phase.
Step 3: Work through the phases in order
The assistants are designed to be used sequentially. Each phase builds on the output of the last. Skipping ahead is possible, but it defeats the purpose. The structure is the point.
A note on the statistical tools: you do not need to know which tool to use before you open the assistant. The workflow surfaces the right tool at the right moment. If you are in the Measure phase and your data is ready, the assistant will prompt you to run the normality test before moving to hypothesis testing. That sequencing is deliberate.
Step 4: Export and share
At any point during a DMAIC project, you can generate an A3 Storyboard or export to PowerPoint. Use this to update your sponsor, brief your team, or document the project for audit purposes. The export pulls from the inputs you have already made, so there is no reformatting required.
The Add-On Tools
Beyond the two core assistants, SimplicityHub offers a set of add-on apps at £29 each. These are included free with the Complete package.
| Add-on | What it does | | --- | --- | | Time and Motion Study App | Record process steps and cycle times in real time, directly in your browser | | Ideas Platform | Capture improvement ideas, route them to reviewers, and track delivery through governance | | Skills Matrix | Map team capability, spot skill gaps, and plan training priorities | | CI Culture Roadmap | A step-by-step plan for building a sustainable continuous improvement culture | | Value Stream Map | Map end-to-end process flow, measure step and wait times, and tag waste visually |
These tools are designed to plug directly into your improvement work rather than sit alongside it. The Value Stream Map, for example, is not a separate diagramming tool: it feeds into the LEAN Assistant workflow and the DMAIC Measure phase.
Free Statistical Calculators: What Is Already Available
Before committing to an assistant, it is worth knowing that SimplicityHub already provides 25 free statistical calculators with no login required. These cover the most commonly used calculations in Lean Six Sigma improvement work.
A selection of what is available for free:
- DPMO and Sigma Level — calculate defects per million opportunities and your current sigma performance
- Cp and Cpk — process capability indices for understanding how well your process meets specification
- Sample Size Calculator — determine the minimum sample size needed for statistically valid conclusions
- Dataset Analysis — upload a CSV or Excel file and get a full Minitab-style output: descriptive statistics, normality test, histogram, and box plot
- Pareto Chart Maker — paste your defect or cost data and generate a ranked chart with a cumulative percentage line
- Control Limits Calculator — calculate upper and lower control limits for your control charts
- Confidence Interval Calculator — for population mean or proportion from sample data
The free calculators are standalone tools. They are useful for quick calculations on live projects. The assistants are different: they embed these calculations inside a guided workflow so the outputs feed forward into the next phase rather than sitting in isolation.
If you are already using the free calculators and finding you need more structure around how the results connect, that is the signal to move to the DMAIC Assistant.