Yellow Belt10 calculators
Yellow Belt calculator map
Find the right calculator for each DMAIC stage, from project definition through control.
Define 2 · Measure 5 · Analyse 1 · Improve 2
Tell us what’s going on — e.g. "I want to know if my process is stable" — and we’ll point you straight to the exact free templates and calculators that help, plus the course that covers them in depth.
25+ free Lean Six Sigma calculators, built for practical improvement work. Measure process capability, Sigma level, cycle time, takt time, OEE, sample size and more. Each tool includes worked examples and interpretation guidance so you understand what the result means, not only the number. No installation, annual licence or sign-up is required: open a calculator in any browser.
Plus free PDF results - download or print your results from any calculator.

Our short guide explains Cp, Cpk, what a good score looks like and how to calculate it — before you use the calculator.
Read the guide →Multiple calculators from this page are scattered throughout the Academy courses — paired with full theory, worked examples, and guided projects. Visitors use the tools. Practitioners understand why they work.
Find the right calculator for each DMAIC stage, from project definition through control.
Find the right calculator for each DMAIC stage, from project definition through control.
Find the right calculator for each DMAIC stage, from project definition through control.
Choose a calculator to open it, or download the printable Calculator Reference Toolkit PDF.
Choose a calculator to open it, or download the printable Calculator Reference Toolkit PDF.
Choose a calculator to open it, or download the printable Calculator Reference Toolkit PDF.
Calculate Defects Per Million Opportunities to measure and benchmark your process quality against Six Sigma performance standards.
Convert your defect rate or process yield into a Sigma Level to understand where your process sits on the Six Sigma performance scale.
Paste your process data and instantly calculate UCL, CL and LCL for I-MR or X̄-R charts.
Calculate the sample size for pass/fail data using zero-acceptance sampling, proportion estimation, or observed-defects confidence interval analysis.
Paste your defect or cost data, rank categories from largest to smallest, and instantly visualise the Pareto principle.
Calculate the cumulative first-pass yield across multiple process steps to find your true end-to-end quality rate.
Quantify the total financial impact of defects, rework, scrap, and warranty costs across your operation.
Measure process capability and centring using Cp and Cpk indices to assess whether your process meets specification limits.
Measure long-term process performance using overall standard deviation to assess whether your process meets specification limits.
Paste your data to instantly visualise the five-number summary, IQR, whiskers, and outliers.
Calculate mean, variance, and standard deviation for a dataset with step-by-step workings shown.
Determine the minimum sample size needed for continuous or attribute data given your confidence level and margin of error.
Calculate the probability of exactly k successes in n trials given a fixed probability p.
Perform a one-sample or two-sample t-test and get the p-value, t-statistic, and decision at your chosen significance level.
Upload a CSV or Excel file, select a numeric column, and get a full Minitab-style analysis with descriptive statistics, normality test, histogram, and box plot.
Calculate the confidence interval for a population mean or proportion given sample data.
Paste two columns of data to calculate Pearson r, R², and the regression equation with a live scatter plot.
Convert a raw score to a Z-score and find the corresponding probability or percentile.
Calculate Overall Equipment Effectiveness by breaking performance down into Availability, Performance and Quality.
Find the pace at which your process must produce one unit to exactly match customer demand.
Calculate average cycle time from total production time and units produced.
Break down total lead time into processing, waiting, and transport components to identify where delays are hiding.
Calculate the ratio of value-added time to total lead time to understand how lean your process really is.
Quantify the financial and capacity gains from reducing changeover time.
Translate available time, cycle time and OEE into a realistic capacity figure.
Test whether the means of three or more groups are statistically equal. Essential for comparing process settings, materials, or operators.
Build p-charts, np-charts, c-charts and u-charts for defective or defect count data where individual measurements aren't taken.
Test for independence between categorical variables or goodness-of-fit. Perfect for analysing survey data and defect classification tables.
Analyse relationships between two categorical variables with frequency tables, percentages, and chi-square significance testing.
Detect small, sustained process shifts using Exponentially Weighted Moving Average and Cumulative Sum control charts.
Build Ishikawa cause-and-effect diagrams interactively. Map the 6Ms to identify and visualise root causes of process problems.
Design and analyse fractional factorial experiments to screen many factors efficiently with fewer runs than a full factorial.
Compare the variances of two populations to determine whether process variation has significantly changed between two conditions.
Assess whether your measurement system produces consistent bias across the full operating range — a key MSA requirement.
Quantify repeatability and reproducibility in your measurement system. Determine whether variation is from the process or the gauge.
Build histograms from raw data with automatic bin sizing, normal distribution overlay, and key descriptive statistics.
Reduce complex multi-variable datasets using Principal Component Analysis. Identify the key factors driving variation in your process.
Monitor multiple correlated quality characteristics simultaneously with T² charts and track rare events with g- and t-charts.
Run Mann-Whitney, Kruskal-Wallis, Wilcoxon and other distribution-free tests when your data doesn't meet normality assumptions.
Test whether your data follows a normal distribution using Anderson-Darling and Shapiro-Wilk before further statistical analysis.
Test whether an observed proportion significantly differs from a target value. Ideal for pass/fail and defect rate comparisons.
Compare before-and-after measurements on the same subjects to determine if a process change produced a significant difference.
Calculate the probability of a given number of rare events occurring in a fixed interval — used for defect counts and arrival rates.
Model the relationship between a continuous input and output. Predict process outcomes and quantify factor significance.
Optimise process settings using central composite or Box-Behnken designs. Find the optimal combination of multiple input variables.
Plot process data over time and apply run chart rules to detect non-random patterns, trends, and shifts without control limits.
Forecast future process performance using moving average, exponential smoothing, and trend decomposition methods.
Calculate statistical tolerance intervals to predict the range that will contain a specified proportion of future process output.
Compare defect rates or pass/fail proportions between two process conditions, machines, or time periods with statistical rigour.
Model product failure rates and predict reliability over time using Weibull distribution fitting. Essential for warranty analysis.
The SimplicityHub calculator library is growing. Got a specific tool or calculation you need? Let us know and we will add it to the roadmap.
Industry Guide
See how these tools apply on the shop floor — OEE, SMED, VSM and more. Practical examples from real manufacturing environments.
Explore manufacturingAI + Lean
Discover how AI is accelerating process improvement. From root cause analysis to automated reporting — the future of CI is already here.
Explore CI with AINot sure which tool fits your project? Our blog walks through real use cases for each one.
Improvement tips straight to your inbox every week.
See all Lean Six Sigma calculators, browse our project templates, or get certified with our recognised courses.
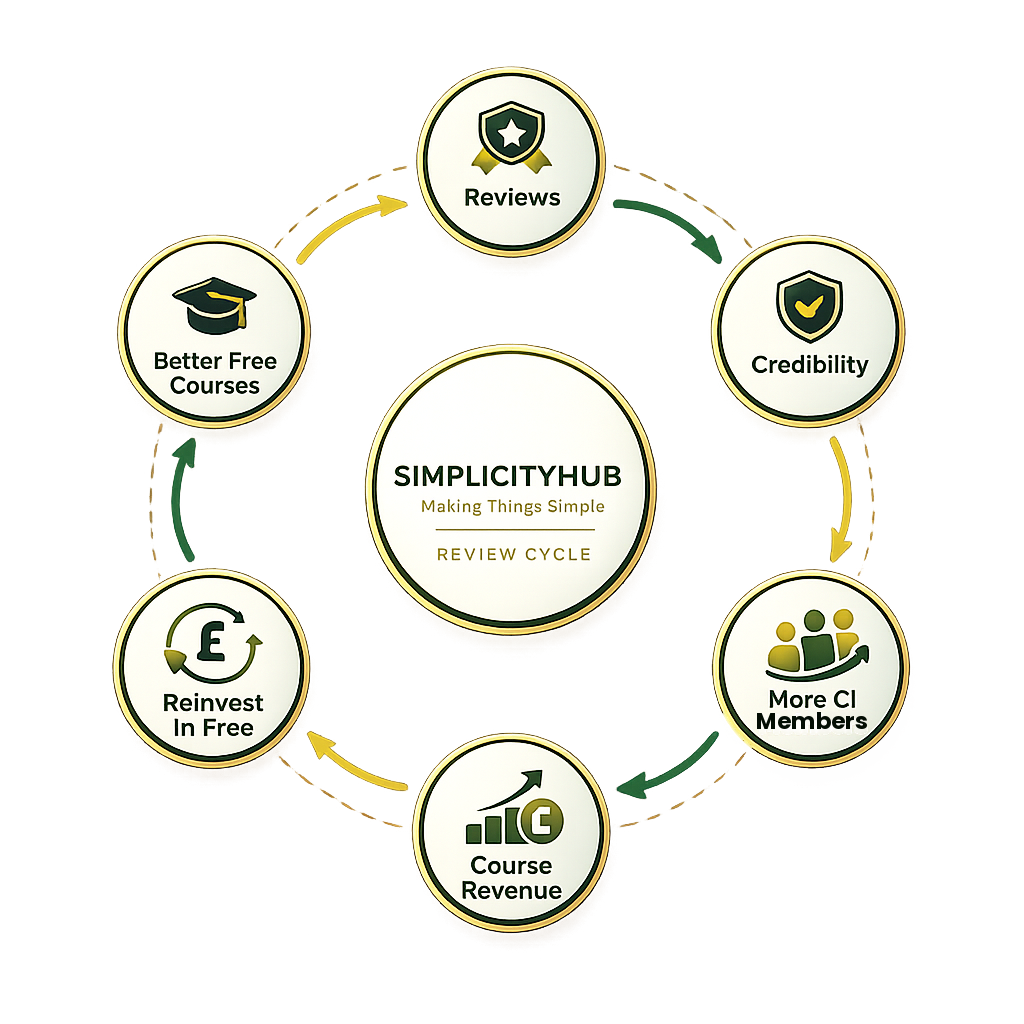
Free courses take time and money to create. Your review gives us credibility, brings in more learners, and we plough that revenue straight back into free resources.

Practical, hands-on guides used by our learners — our Ultimate DMAIC and Ultimate Lean playbooks.