What Does SIPOC Stand For?
SIPOC (pronounced sigh-pock) is a visual tool used to document a business process from beginning to end at a high level. It stands for Suppliers, Inputs, Process, Outputs, and Customers. If you want a straight answer: it is a simple summary table that helps a team understand exactly what a process does, who is involved, and what it produces, before they try to fix it.
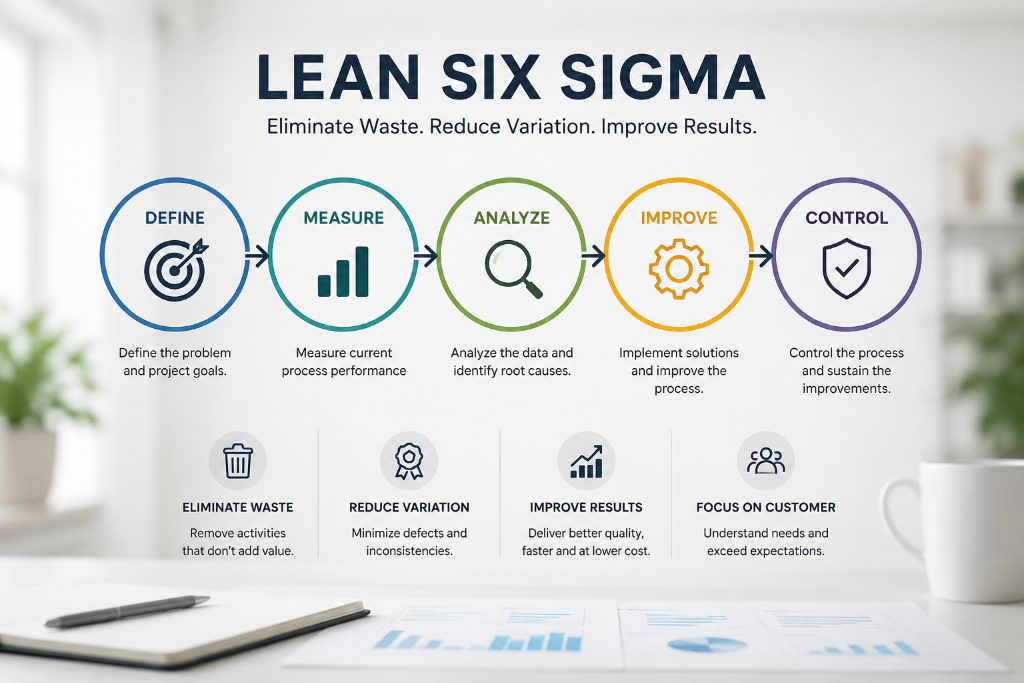
In the world of Lean Six Sigma, jumping straight into detailed process mapping can be overwhelming. A SIPOC diagram acts as the perfect starting point during the Define phase of a DMAIC project. It provides a "10,000-foot view" of the workflow, ensuring everyone agrees on the boundaries of the process before any detailed analysis begins.
What is a SIPOC Diagram Used For?
When a process is broken, it is rarely the fault of just one person or one department. Problems usually occur in the handovers between teams. The SIPOC diagram is used to create a shared understanding among all stakeholders. Its primary uses include:
- Defining the scope: Clearly establishing where a process starts and where it ends, preventing "scope creep" during an improvement project.
- Identifying key stakeholders: Highlighting exactly who supplies the inputs and who receives the final outputs (the customers).
- Clarifying requirements: Understanding what the "Customer" expects from the "Output", and consequently, what "Inputs" are required from the "Supplier".
- Onboarding team members: Providing a simple, one-page summary to explain a complex process to leadership or new project members.
The 5 Elements of SIPOC Explained
To build a SIPOC, you typically start with the Process, then list the Outputs and Customers, and finally work backwards to the Inputs and Suppliers. Here is what each section means:
- Supplier: The person, department, or external company that provides the materials, information, or resources needed to run the process.
- Input: The raw materials, data, documents, or resources provided by the suppliers.
- Process: The 5 to 7 high-level steps that transform the inputs into the outputs. (Keep it simple—no decision trees or detailed loops here).
- Output: The final product, service, decision, or document created by the process.
- Customer: The person, department, or external client who receives the output. (Remember, a "customer" can be internal, like the next department down the hall).
Mini SIPOC Diagram Example: Coffee Shop
To understand the flow, here is a text-based mini diagram of how the SIPOC connects the dots for a simple process like making a coffee:
Real-Life Example: The Employee Onboarding Process
Let's look at a practical office example. An HR department wants to improve their employee onboarding process because new hires are complaining about not having laptops on their first day. Before diving into complex flowcharts, the team builds a SIPOC.
| Suppliers | Inputs | Process (High-Level) | Outputs | Customers |
|---|---|---|---|---|
| Recruitment Team | Signed contract, Start date | 1. Receive signed contract | Welcome email | New Employee |
| Hiring Manager | Role requirements, Software needs | 2. IT hardware provisioning | Configured laptop | New Employee |
| IT Department | Laptops, System access | 3. Set up payroll & benefits | Active payroll record | Finance Dept |
| Facilities | Building pass, Desk space | 4. Office orientation (Day 1) | Building access pass | New Employee |
By mapping it out like this, the HR team immediately sees that the "IT Department" and the "Hiring Manager" are critical suppliers. If the Hiring Manager doesn't provide the "Software needs" input on time, the IT process step fails. The SIPOC clarifies exactly where communication breakdowns are happening.
When to use SIPOC vs When NOT to use it
A SIPOC is a fantastic tool, but it is not meant for everything. Knowing when to use it is key to continuous improvement.
- USE IT WHEN: You are starting a new project. You need to agree on the start and end points of a process. You need to explain the workflow to senior management quickly. You are unclear on who the true customer of the process is.
- DO NOT USE IT WHEN: You need to identify specific bottlenecks, measure cycle times, or find deep root causes. For that, you need a detailed Value Stream Map or a Swimlane Process Map. A SIPOC is strictly for the high-level view.
Summary
The SIPOC diagram is one of the most practical and widely used tools in the Lean Six Sigma toolkit. By forcing a team to outline the Suppliers, Inputs, Process, Outputs, and Customers, it ensures everyone is on the same page before attempting to improve the process. It removes ambiguity, defines the scope, and sets a clear foundation for the deeper analysis that will follow.
Continue your learning journey
Ready to dive deeper? Explore our related guides: