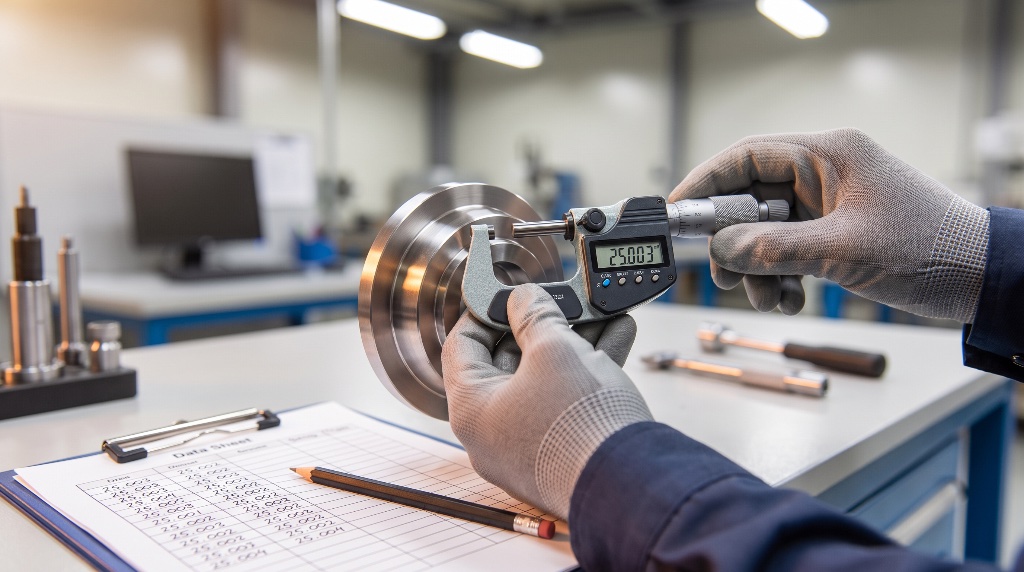
Quick answer: A Gage R&R study measures how much process variation comes from the measurement system itself, separating it into repeatability (same person, same gage, same part) and reproducibility (different people, same gage, same part). The decisions made before data collection, including part selection, operator choice, and blinding, determine whether the study produces useful results.
The Study That Should Come Before Everything Else
You collect data. You build a control chart. You spot an out-of-control signal and launch an investigation. The team spends two weeks chasing a root cause that turns out to be measurement noise, not a real process shift.
This happens more often than most teams admit. Teams spend time and money trying to fix and improve process performance when the real problem is in the measurements, not the process. Checking the measurement system first would have saved all of it.
A Gage R&R study is a method to assess how much process variation comes from the measurement system itself. It belongs in the Measure phase of any DMAIC project. Without it, every downstream analysis sits on uncertain ground.
What Gage R&R Actually Measures
A measurement system has five sources of variation: bias, linearity, stability, repeatability, and reproducibility. Bias, linearity, and stability are addressed during calibration. Repeatability and reproducibility are measured through a Gage R&R study.
Repeatability is the variation when the same person uses the same gage on the same part multiple times. In Gage R&R terminology, this is called Equipment Variation (EV). It answers: if one operator measures the same feature ten times, how much do the readings scatter?
Reproducibility is the variation when different people use the same gage to measure the same part. It answers: if three operators each measure the same feature, how much do their averages differ?
A "gage" in this context can be any measurement tool: simple like calipers and rulers, complex machinery, or even software.
When a measurement system has poor R&R, parts near specification limits may be incorrectly classified. Good parts get rejected (Type I error). Defective parts get accepted (Type II error). One costs scrap and rework. The other costs warranty claims and customer complaints.
Which Type of Study Do You Need?
There are three types of variable Gage R&R study: Crossed, Nested, and Expanded.
Crossed Gage R&R is the standard design. Each operator measures each part. It requires a balanced design with random factors and is used for non-destructive testing. This is the study most practitioners will run most often.
Nested Gage R&R applies when only one operator measures each part, and is used for destructive testing where the part is consumed or altered during measurement.
Expanded Gage R&R includes more factors (up to eight) beyond operator and part. Use it when you suspect factors like fixture, shift, or location contribute to measurement variation.
If your measurement output is pass/fail or categorical rather than continuous, you need an Attribute Gage R&R instead. Common examples include go/no-go gages, visual inspections, colour matching, and surface finish comparisons. A standard attribute study uses 30 parts, 3 operators, and 3 trials for a total of 270 measurements.
The rest of this guide focuses on the crossed design.
When to Run a Gage R&R Study
Gage R&R is not a one-time qualification exercise. Run one when:
- Implementing a new measurement system or gage
- A gage has been repaired or modified
- Operators report inconsistent measurement results
- As part of a routine quality control schedule
- During the Measure phase of a DMAIC project
- New workers are assigned or significant process changes occur
The common thread: any time you have reason to question whether your measurements reflect reality.
Planning the Study: Where Most Gage R&R Studies Succeed or Fail
The calculations are mechanical. The planning is not. Every decision below shapes the validity of your results before a single measurement is recorded.
Selecting Parts
A study typically uses 2 to 3 appraisers and 5 to 10 parts, with each appraiser measuring the parts multiple times. A stronger design uses 10 to 15 parts representing the low, middle, and high end of the specification range.
The critical rule: parts must be selected to reflect the range of variation seen in the manufacturing process. Do not take 10 parts off the line in a row. Selecting parts that cover the entire range of tolerance gives a more accurate percentage of contribution from GR&R to the total variation.
If you grab consecutive parts from a stable process, they cluster near the mean. Your part variation looks artificially low, inflating the percentage attributed to measurement variation. The study fails not because the gage is poor but because the part selection was.
For attribute studies, include parts that are clearly acceptable, clearly unacceptable, and borderline (near specification limits). The borderline parts are the ones that test your measurement system's discrimination.
Selecting Appraisers
Use 2 to 3 appraisers. They should be the people who actually use the gage in production. Selecting your most skilled operator and your quality engineer gives you a flattering result that does not represent daily reality.
Setting the Number of Trials
Each operator should measure each part at least twice, though three trials are recommended for more reliable results. More trials provide better statistical power but also require more time and resources.
The n x k Rule
The product of parts (n) times appraisers (k) should be greater than 15. With 10 parts and 2 appraisers you get 20. With 5 parts and 2 appraisers you get 10, which falls short. This rule exists because it gives more confidence in the results.
A practical combination: 10 parts, 2 appraisers, 3 trials = 60 measurements. Manageable in a morning. Strong enough for reliable conclusions.
Check Instrument Resolution
Before running a single measurement, verify that your gage has adequate resolution. Skipping this verification step could cause misdirected efforts, wasting time and money trying to solve problems that do not even exist. A gage that reads to the nearest millimetre cannot meaningfully assess variation measured in tenths.
Collecting Data Without Contaminating It
The data collection protocol exists to prevent one thing: operators influencing each other's results. Break the protocol and you are measuring social dynamics, not gage capability.
Parts must be measured in random order. Start with Appraiser A. They measure all parts in random order. Record the results. Move to the next appraiser without them being able to see the results from other appraisers. Continue until all trials are complete. Ensure that an appraiser cannot see their own results from previous trials.
In practice, this means:
- Number the parts but keep the numbering hidden from operators during measurement
- Have a separate person record results or use a system that hides prior entries
- Run trials at different times if necessary to prevent operators conferring
- Control the measurement environment (temperature, lighting, fixturing) so that variation comes from the gage and the operator, not the surroundings
Three Calculation Methods: Range, Average and Range, and ANOVA
Once data is collected, you have three methods to analyse it.
| Method | What It Gives You | When to Use It |
|---|---|---|
| Range | Quick approximation of total measurement variability | Rough screening only. Does not separate repeatability from reproducibility |
| Average and Range | Repeatability (EV), reproducibility (AV), and part variation separately | Standard analysis when software is unavailable |
| ANOVA | All of the above, plus the operator-by-part interaction | Recommended default. The most widely used and accurate method |
The ANOVA method is the most widely used and accurate method for measurement system repeatability and reproducibility. It also quantifies the interaction between the operator and the parts , which the Average and Range method cannot isolate. That interaction term tells you whether certain operators struggle with certain part types, a diagnostic the other methods miss entirely.
Most statistical software (Minitab, JMP, SPC packages) defaults to ANOVA. Use it unless you have a specific reason not to.
Interpreting Results and What to Do When the Study Fails
The output of a Gage R&R study is a percentage: the proportion of total observed variation attributable to the measurement system (%GR&R). A lower percentage means less measurement noise relative to actual part differences. Industry guidelines divide results into bands ranging from acceptable through marginal to unacceptable.
When a measurement system falls within acceptable limits, you can trust the data it produces. When it sits in the marginal zone, usability depends on the application, the cost of the gage, and the cost of misclassification. When results are unacceptable, the measurement system needs corrective action before you use it for process decisions.
If a study fails, the corrective path depends on which component dominates:
High repeatability (EV) variation points to the gage itself. Check calibration, wear, resolution, and fixturing. A worn anvil on a micrometer, a loose fixture, or insufficient display resolution all inflate EV.
High reproducibility (AV) variation points to the operators. Look at training, technique differences, and measurement procedure clarity. If one operator consistently reads high, the issue is method, not equipment.
Significant operator-by-part interaction (visible only in ANOVA results) means some operators handle certain part types differently. This often surfaces with flexible parts where holding technique matters, or complex features where measurement position is ambiguous.
Run the study again after making corrections. A Gage R&R is a diagnostic, not a one-time gate.
Five Pitfalls That Invalidate Results
Parts too similar. Selecting parts from a narrow range inflates %GR&R because part variation is artificially low. Cover the full tolerance range.
Operators can see results. If operators see each other's readings or their own prior measurements, results converge artificially, understating the true measurement variation. Blind the study.
Skipping the resolution check. A gage that cannot discriminate between parts at the required level will fail the study regardless of operator skill. Verify resolution before you begin.
Using the Range method for decisions. The Range method provides a quick approximation but does not compute repeatability and reproducibility separately. It is a screening tool, not a decision tool.
Running the study once and filing it. Gage R&R is important when new workers are assigned, new tools are introduced, or significant process changes occur. It belongs on a routine quality control schedule, not in a drawer.
Fitting Gage R&R Into Your Improvement Work
A Gage R&R study is not a standalone exercise. It sits at the front of the Measure phase, validating the data pipeline before you feed data into capability studies, process improvement analysis, or statistical process control.
The sequence matters. Run the Gage R&R first. If it passes, proceed with confidence. If it fails, fix the measurement system before investing time in process analysis. No amount of sophisticated statistical work compensates for data you cannot trust.