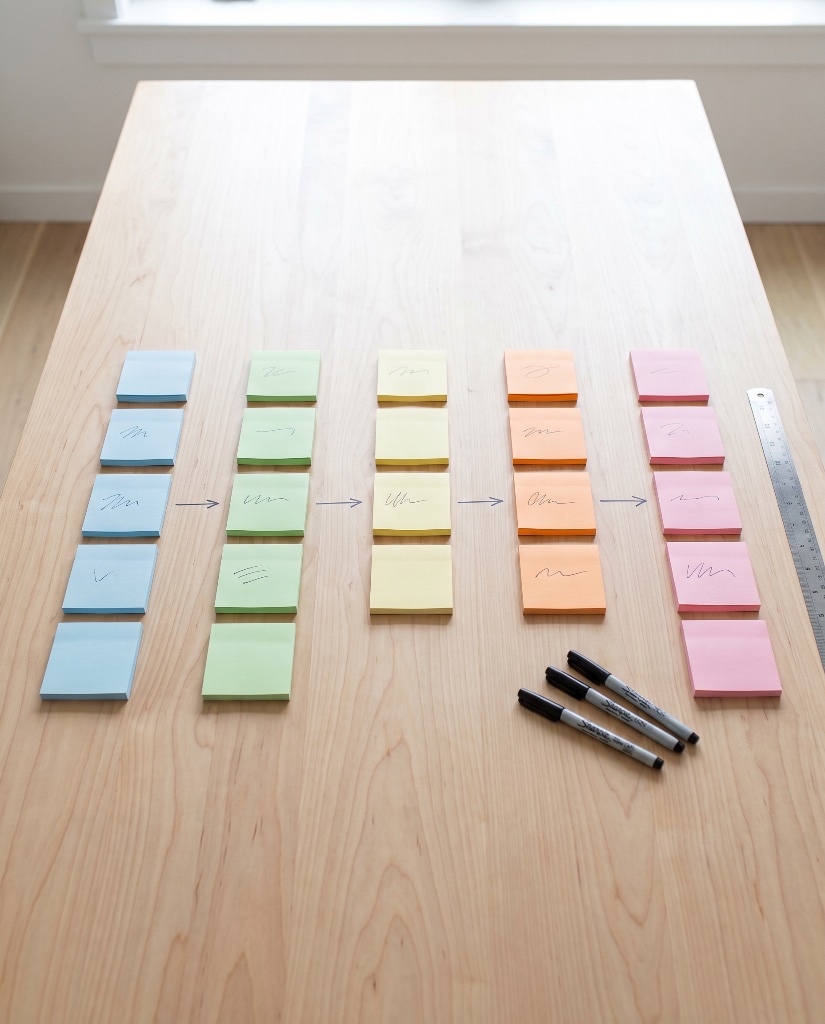
A SIPOC diagram is a data collection tool used by Six Sigma process improvement teams to assist in gathering information about suppliers, inputs, processes, outputs, and customers of a process. Five columns. One page. The entire scope of a process captured at a level high enough to align a room full of people who each see the work differently.
The acronym is pronounced "sigh-pock." It came from the Total Quality Management movement in the 1980s and was later adopted by Lean management and Six Sigma practitioners. Today it is widely used in Kaizen, Lean, and Six Sigma projects as a starting point before teams move into detailed process mapping or value stream analysis.
There is a contradiction built into the name, though, and it is worth noticing early. SIPOC reads left to right from Suppliers to Customers. But Lean thinking defines value in terms of what the customer is willing to pay for. Starting from the supplier end is starting from the wrong end. That tension between the acronym and the methodology shapes how the best improvement teams actually build this diagram, and it is the reason this guide does not follow the letters in order.
What Each Letter Stands For
Suppliers
The people, departments, or organisations that provide the inputs your process needs. Internal suppliers may include departments or teams within the same organisation, while external suppliers could be vendors, contractors, or third-party providers. A packaging line might list a film supplier, a label printer, and the warehouse team that stages raw materials. An HR department might list hiring managers, IT, and facilities.
Inputs
Everything the process consumes or transforms: raw materials, data, documents, instructions, tools. In a manufacturing context, inputs include instructions, tools, and materials. In a service context, inputs might be a customer enquiry, an application form, or a set of policy documents.
Process
A high-level flowchart of the key five to seven core activities that comprise the process. This is the "35,000-foot" view. You are not documenting every click or handoff. You are capturing no more than 10 broad steps that show where the process starts and where it finishes. The detailed steps come later, in the full flowchart.
Outputs
What the process delivers: finished goods, reports, approvals, notifications, services rendered. In manufacturing, outputs are finished goods. In service work, outputs might be a resolved ticket, a hired employee, or a dispatched order.
Customers
The people or groups who receive the outputs. Customers can be internal (the next department in the chain) or external (end users, clients, regulatory bodies). The critical point is that customers define whether your outputs have value. Everything else in the diagram exists to serve them.
SIPOC vs COPIS: Why the Column Order Matters
Read the acronym left to right and you start with Suppliers. But a good place to start the analysis is, in fact, on the customer end. Beginning with the customer aligns with the Lean focus, where value is defined in terms of what the customer is willing to pay for.
This is not a trivial distinction. Some organisations use the opposite acronym COPIS, which puts customer requirements first and designs processes accordingly. The main difference: SIPOC starts with suppliers and inputs and is suited to understanding an existing process. COPIS is more customer-centric and focuses on meeting customer needs.
In practice, even teams that call their diagram "SIPOC" benefit from filling in the Customers column first. When you name your customer before you describe your process, you force a question most improvement teams skip entirely: who receives this output, and what do they actually need from it? That question changes what you write in every other column.
| SIPOC | COPIS | |
|---|---|---|
| Starting point | Suppliers and inputs | Customer requirements |
| Best for | Understanding an existing process | Designing or redesigning a process around customer needs |
| Lean alignment | Weaker (starts from supply side) | Stronger (starts from value definition) |
| When to use | Process documentation, onboarding new team members | New service design, customer experience improvement |
When to Use a SIPOC Diagram
SIPOC is not a universal tool. It solves specific problems at specific moments.
Before detailed process mapping. A SIPOC should be created before constructing a flowchart, since it gathers relevant information about the process that the team needs to understand before going deeper. It is an effective way to align teams, clarify the scope of a project, and create a common vision before engaging in value stream analysis or mapping a specific process.
In the Define phase of DMAIC. SIPOC plays a crucial role in the Define phase of the DMAIC methodology, helping project teams clearly articulate the scope of the process, identify key stakeholders, and align project goals with customer requirements. At this stage, it helps clarify the project's scope, design the project charter, and define the problem statement, establishing clear boundaries for where the process begins and ends.
In manufacturing. SIPOC diagrams are highly popular in manufacturing projects as they offer a clear and high-level perspective on production processes, outlining important components such as suppliers (raw material providers), inputs (instructions, tools, materials), processes (quality checks, packaging), outputs (finished goods), and customers (end users).
In service design. SIPOC diagrams are also used in service design as they map the end-to-end process to deliver services, identifying touch points and pain points in the customer journey.
For onboarding. SIPOC diagrams are helpful when introducing new team members to a process and when planning out new business concepts. A new starter can read a single SIPOC and understand what a process does, who it serves, and who feeds it, in under five minutes.
When Not to Use SIPOC
SIPOC gives you a 35,000-foot view. If you need to see individual handoffs, decision points, queue times, or parallel paths, you need a different tool. A value stream map captures cycle times, wait times, and inventory between steps. A swimlane diagram shows who does what across functional boundaries. SIPOC tells you what the process touches. These tools tell you how it behaves.
How to Build a SIPOC Diagram Step by Step
Construction should be carried out in workshops with multidisciplinary teams, ensuring diverse perspectives and the involvement of key stakeholders. A SIPOC built at a desk by one person will reflect one person's understanding of the process. That defeats the purpose.
Here is the build sequence. Notice it does not follow the acronym order.
Step 1: Name Your Customers
Start from the right side of the diagram. Who receives the output of this process? List both internal and external customers. Be specific: "warehouse dispatch team" is more useful than "internal customer."
Step 2: Define the Outputs
What does each customer actually receive? A finished product, a report, a decision, a notification? List the tangible deliverables. If an output does not map to a customer, question whether it needs to exist.
Step 3: Map the Process (5 to 10 Steps)
Write the high-level steps that transform inputs into those outputs. Make sure you only list the few vital, general steps and that you don't go into too much detail. Start with the trigger (what kicks the process off) and end with delivery to the customer.
Step 4: Identify the Inputs
What does each process step consume? Raw materials, information, tools, approvals. Trace backwards from each step to find what it needs to function.
Step 5: List the Suppliers
Who provides each input? Concentrate only on those suppliers who have a direct impact on the process outputs, not every possible supplier. A SIPOC with thirty suppliers is a SIPOC that nobody reads.
SIPOC Examples
Example 1: Desk Assembly Line (Manufacturing)
| Suppliers | Inputs | Process | Outputs | Customers |
|---|---|---|---|---|
| Timber supplier | Cut timber panels | 1. Receive and inspect materials | Assembled desks (passed QC) | Retail distribution centre |
| Hardware supplier | Screws, brackets, hinges | 2. Stage components at assembly stations | Assembly instructions (packed) | End customers (via retailer) |
| Packaging supplier | Cardboard boxes, foam inserts | 3. Assemble desk frame and attach top | QC inspection reports | Quality manager |
| Internal: design team | Assembly instructions, drawings | 4. Fit hardware (drawers, cable ports) | Packaged units on pallets | Warehouse dispatch team |
| Internal: warehouse | Staged component kits | 5. Quality check against spec | Defect logs | Continuous improvement team |
| 6. Pack and label | ||||
| 7. Palletise and transfer to dispatch |
Example 2: Customer Support Ticket Resolution (Service)
| Suppliers | Inputs | Process | Outputs | Customers |
|---|---|---|---|---|
| Customer (via web form, phone, email) | Support request with issue description | 1. Receive and log enquiry | Resolved ticket with resolution notes | Customer (external) |
| Internal: product team | Product documentation, known issues list | 2. Categorise and prioritise | Customer satisfaction survey | Customer success manager |
| Internal: IT | CRM system access, diagnostic tools | 3. Assign to support agent | Escalation report (if unresolved at L1) | L2 support team |
| Knowledge base | Troubleshooting articles, FAQ content | 4. Investigate and diagnose | Updated knowledge base article | Future support agents |
| Internal: billing | Account and billing records | 5. Resolve or escalate | Response time and resolution metrics | Operations manager |
| 6. Confirm resolution with customer | ||||
| 7. Close ticket and update records |
Both examples follow the same principle: customers are named specifically, outputs map to those customers, and the process stays at 7 steps. The detail lives in the columns either side of Process, not in the process steps themselves.
SIPOC+CM: The Extended Version
Standard SIPOC captures five elements. For projects that need more rigour, an extended version called SIPOC+CM adds two columns: Constraints and Measures.
Constraints are the limitations the process operates within: regulatory requirements, budget caps, capacity limits, SLAs, or policy restrictions. Naming these upfront prevents the team from designing improvements that cannot be implemented.
Measures are the metrics that tell you whether the process is performing. Cycle time, defect rate, first-contact resolution, throughput. Adding these to the SIPOC means the team agrees on how success is measured before they start collecting data.
SIPOC+CM is particularly useful in Six Sigma projects where the diagram feeds directly into the Measure phase of DMAIC. The Measures column becomes the starting point for your data collection plan.
SimplicityHub has both a standard SIPOC template and a SIPOC-R template that adds a Requirements column for capturing customer and process requirements alongside the core five elements.
Benefits and Limitations
What SIPOC Does Well
SIPOC highlights interdependencies between areas and functions, enabling the identification of waste, redundancies, and potential communication failures. It is a strategic alignment tool as much as a process mapping tool.
The results can be significant. A small manufacturing firm increased its product engineering department's productivity by more than 40% with process improvements that included stakeholder analysis using a SIPOC diagram.
A well-built SIPOC also forces consensus. When five people in a room each have a different mental model of the same process, the act of filling in five columns together surfaces those differences before they become problems downstream.
Where SIPOC Falls Short
The high-level view can oversimplify complex business processes. It does not capture the details of intricate processes, and the focus on key elements may not offer the right level of detail for in-depth analysis or reveal the relationships between different activities. SIPOC models are also static in nature, so they may not be suitable when process requirements evolve frequently.
If your process has fifteen decision points, three parallel paths, and handoffs across four departments, a SIPOC will not show you any of that. You need a detailed flowchart, a swimlane diagram, or a value stream map.
SIPOC and DMAIC: Where It Fits
SIPOC lives in the Define phase of DMAIC. Its job is to give the project team a shared, bounded view of the process before they start measuring it.
In the Define phase, SIPOC helps design the project charter, define the problem statement, and establish clear boundaries for where the process begins and ends. This matters because a DMAIC project without clear scope tends to expand until it stalls.
A real example: at four Northwell Health primary care practice sites in Long Island, NY, a DMAIC project to improve discrete data documentation started with the creation of a high-level process map using a SIPOC diagram. The SIPOC defined what "data documentation" meant in practice, who supplied the data, and who consumed it, before the team moved into Measure.
Once the SIPOC is complete, it bridges into the Measure phase. The Outputs column tells you what to measure. The Customers column tells you whose requirements define "good." The Process column gives you the steps where you will collect data. Without that bridge, teams often measure what is easy rather than what matters.
Common Mistakes When Building a SIPOC
Too many process steps. If your Process column has twenty steps, you have drawn a flowchart in a SIPOC template. Scale back to the 5 to 10 high-level activities that define the process boundaries.
Listing every supplier. Not every vendor or department that touches the process belongs in the diagram. Focus on suppliers who have a direct impact on the process outputs.
Skipping the workshop. A SIPOC built by one person captures one perspective. The tool exists to surface different understandings of the same process. Run it as a group exercise or accept that your diagram has blind spots.
Starting from Suppliers. The acronym reads left to right, but the build should start from Customers. Name who receives the output, then work backwards. Otherwise you risk describing a process that delivers what the supplier provides rather than what the customer needs.
Treating the SIPOC as the final map. SIPOC is a starting point, not a destination. It scopes the process for deeper analysis. Teams that stop at the SIPOC and never build a detailed flowchart or value stream map have a nice summary but no mechanism for finding root causes.
Frequently Asked Questions
What is SIPOC in DMAIC?
SIPOC is a tool used in the Define phase of DMAIC to establish the scope and boundaries of the process under investigation. It helps project teams design the project charter, define the problem statement, and identify key stakeholders before moving into data collection in the Measure phase.
Is SIPOC still used?
Yes. SIPOC is a tool widely used in Kaizen, Lean, and Six Sigma projects across manufacturing, healthcare, and service industries. Its simplicity is the reason it persists: a team can build one in 30 to 60 minutes and walk away with a shared understanding of a process that previously existed only as separate mental models.
What is the basic SIPOC diagram?
A basic SIPOC diagram is a table with five columns: Suppliers, Inputs, Process (5 to 7 high-level steps), Outputs, and Customers. It captures a "35,000-foot" view of the process on a single page, showing who provides what, what happens to it, what comes out, and who receives it.
What is a SIPOC diagram used for?
SIPOC is used before constructing a detailed flowchart to gather relevant information about a process. Common uses include scoping DMAIC projects, aligning cross-functional teams, introducing new team members to a process, mapping manufacturing production flows, and designing service delivery processes.